
What is Placer AI, exactly?
Think about this for a second: every time someone carries their smartphone into a coffee shop, a mall, or a strip center – and they’ve opted in to location sharing – that signal gets collected, anonymized, and aggregated.
Placer AI is the company that turns billions of those signals into something actually useful.
Founded in 2018 by Noam Ben-Zvi (CEO), Oded Fossfeld (CTO), and Ofir Lemel (CPO), Placer AI launched out of Israel and set up its U.S. headquarters in Covina, California. The timing felt almost wrong at first, and then COVID-19 hit.
Suddenly, a tool that tracked physical foot traffic became one of the most watched data sources in the country. Who’s open? Who’s closed? Who’s recovering faster? Placer AI had the answers when almost nobody else did.
Fast forward to 2024, and the company hit $100 million in Annual Recurring Revenue (ARR) and raised its valuation to $1.5 billion, after quietly closing a $75 million funding round.
That’s not a fluke, that’s a company that found real product-market fit.
Key Features
1. Foot Traffic Analytics
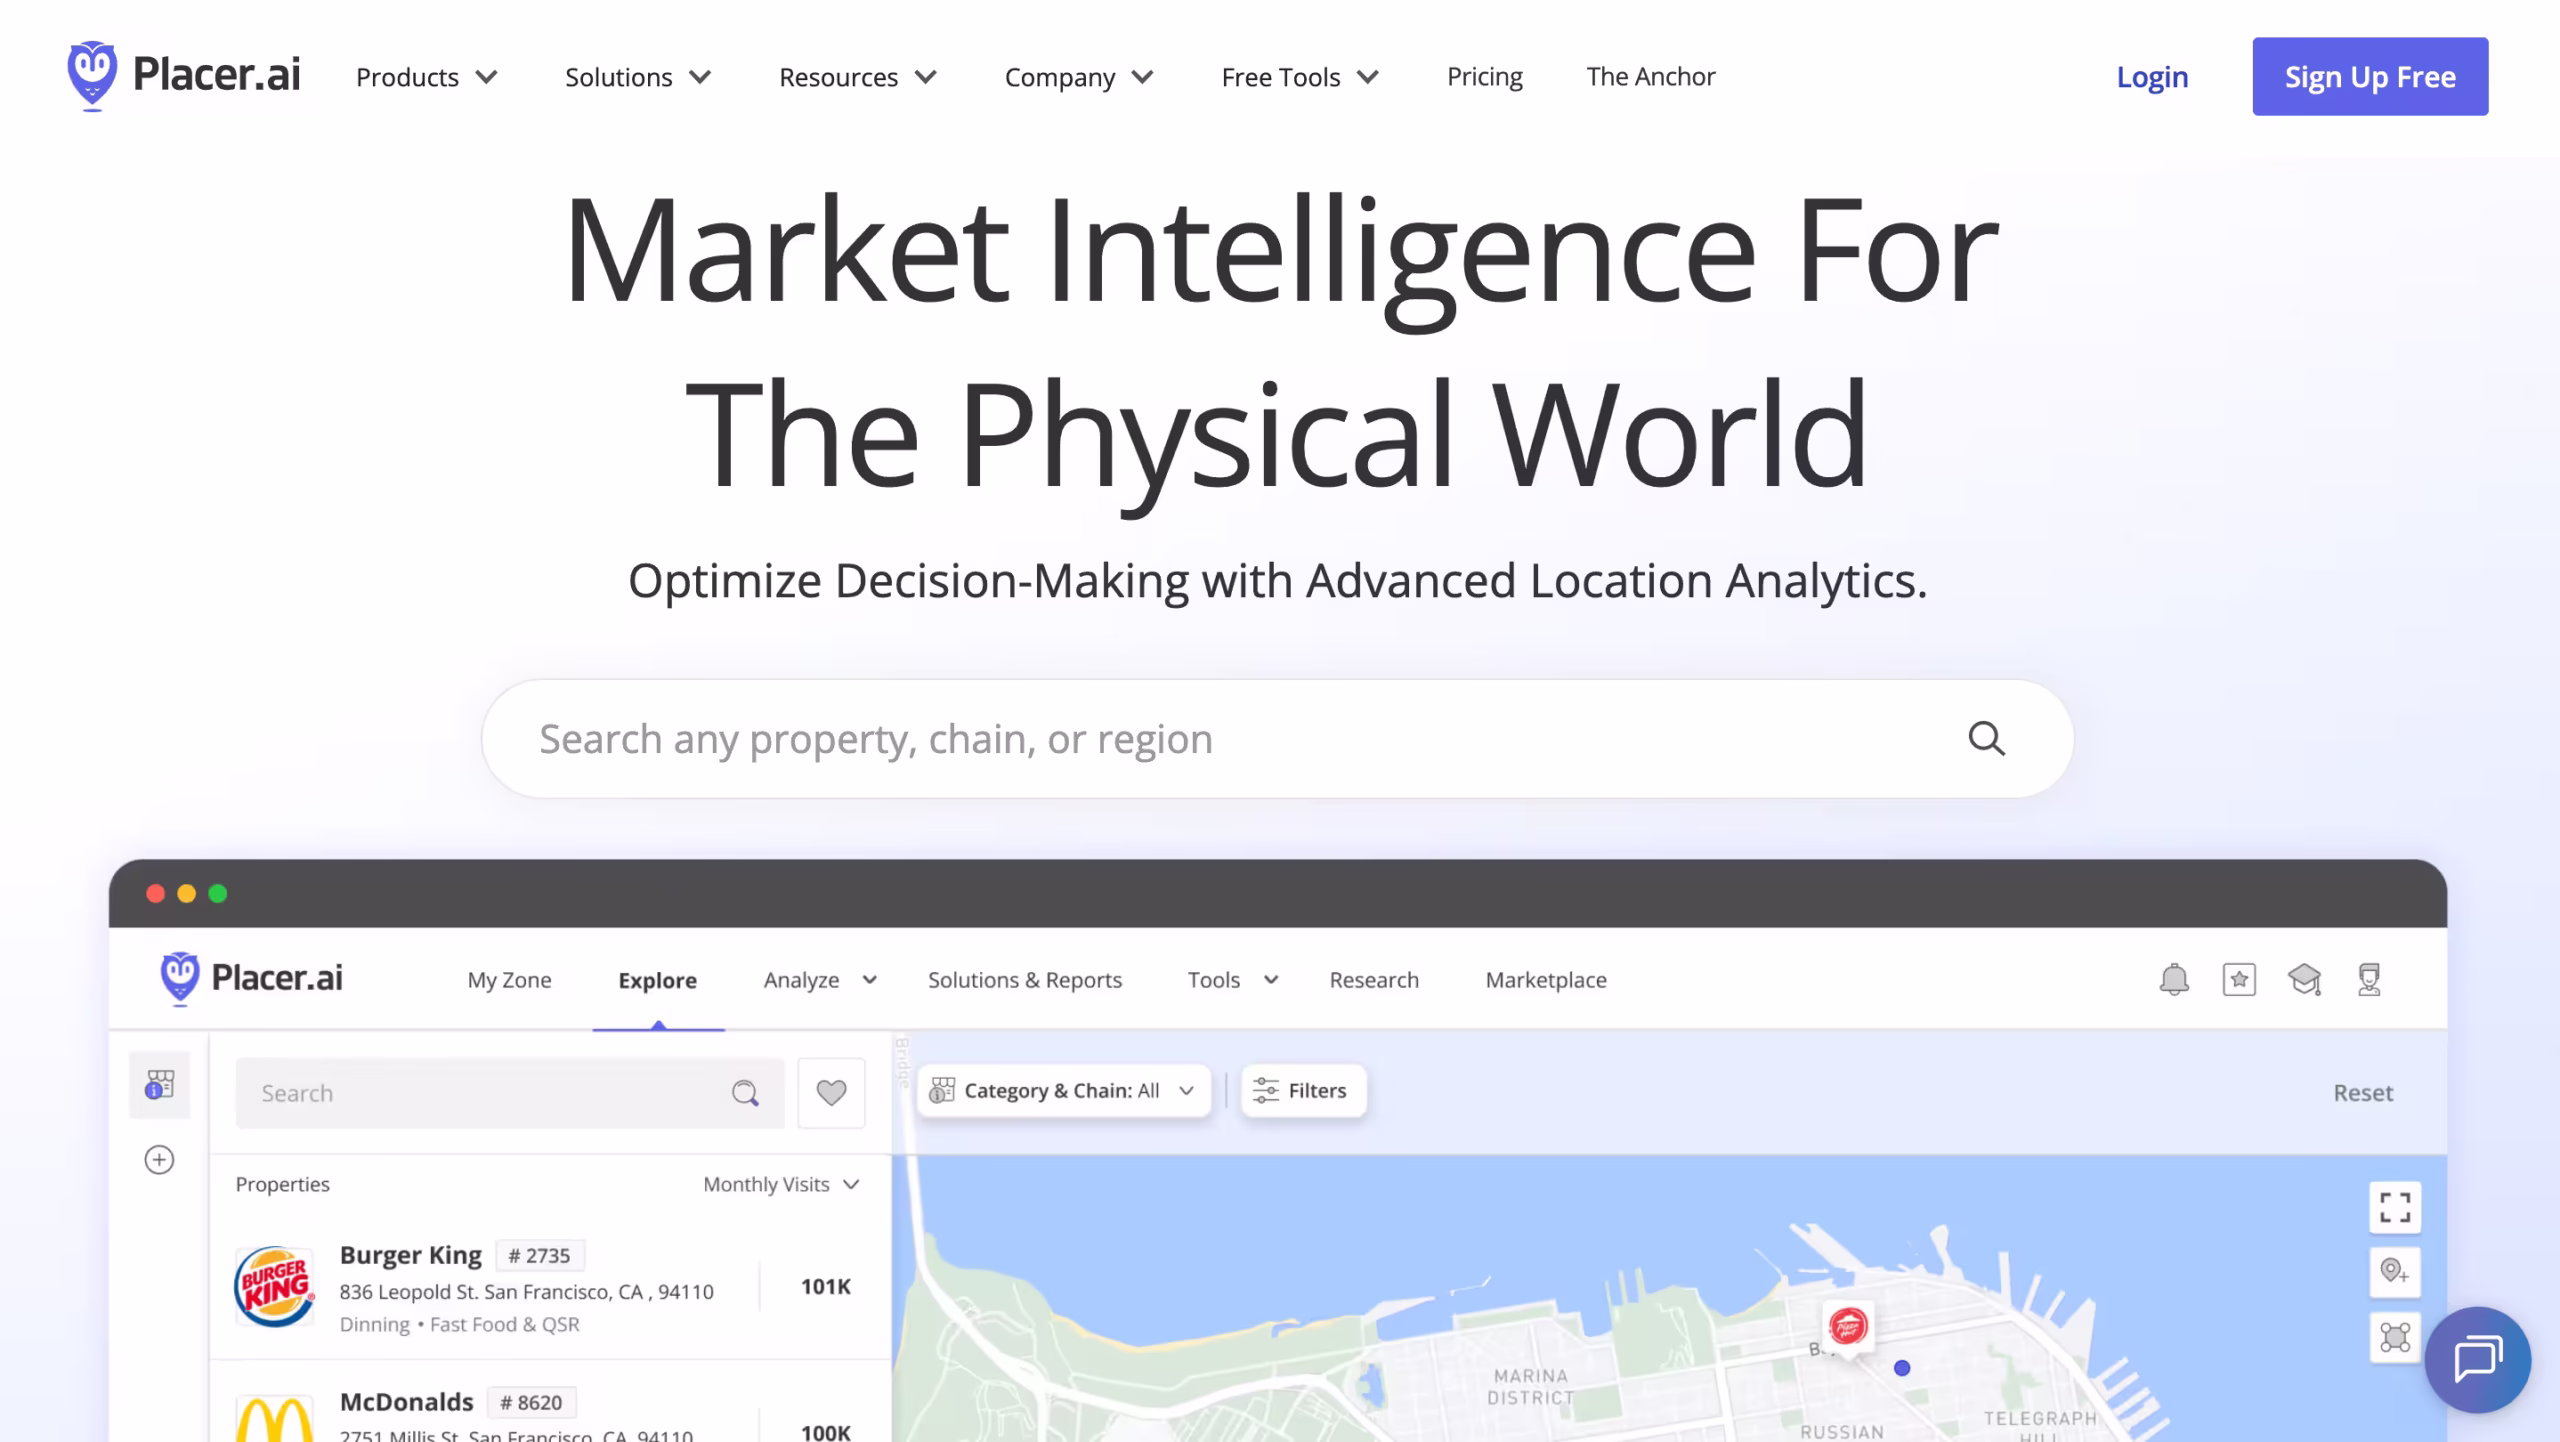
The heart of the platform. You can pull visit counts, dwell times, and peak hour breakdowns for virtually any commercial property in the US. Want to know how busy a Target in Austin is on Sunday afternoons compared to its main competitor two miles away? Placer can tell you.
2. Trade Area Analysis
Where do a venue’s visitors come from? Placer maps the home and work locations of customers – still anonymized – to show you the actual catchment area of any location. This is gold for site selection.
3. Demographic Insights
Placer layers in income, age, household size, and lifestyle segmentation data on top of the foot traffic numbers. You’re not just seeing how many people, you’re seeing who they are.
4. Competitive Benchmarking
This is where retail and CRE teams really light up. You can compare your property’s performance against direct competitors, track market share shifts over time, and see which brands are growing in a given trade area.
5. True Trade Area & Cross-Shopping
Placer’s “Favorite Places” feature shows where your visitors also go, which gives brands a cleaner picture of their actual competitive set, not just the obvious ones.
6. Custom Reports & API Access
Enterprise customers can pull data feeds directly into their own tools, dashboards, or models. The API is robust and designed for teams that want to build custom workflows around location data.
7. User Experience
The dashboard is clean and genuinely intuitive. You can generate a report on any US venue in minutes without needing a data science degree. Filters are easy to navigate, visualizations are strong, and the export functions work well.
The main friction point users mention is that onboarding can take time for enterprise users, and the API has a steeper learning curve if your team isn’t technically strong.
The customer success team, which is included in paid subscriptions, helps close that gap, but it’s still something to factor in.
How Accurate Is It?
This is the fair question. Placer AI draws its data from a massive, anonymized panel of mobile devices, built through partnerships with apps and SDKs where users have opted in to location sharing.
The methodology involves machine learning models that correct for panel biases and project results across the full population.
Independent reviews and users in the CRE world consistently report that Placer’s numbers correlate well with ground truth data. It’s not perfect, no mobile data panel is, but it’s widely considered one of the most reliable options in the market.
The company has 781 employees and has raised over $241 million in total funding, with investors including Goldman Sachs and other institutional names. That level of backing doesn’t go to companies producing sloppy data
Competitor’s Comparison
| Feature | Placer AI | SafeGraph | Foursquare | Unacast | Cuebiq |
|---|---|---|---|---|---|
| Primary Use Case | Foot traffic & location intelligence for business decisions | Raw geospatial & POI datasets for data teams | Global location intelligence & ad attribution | US foot traffic & human mobility data | Offline audience measurement & ad attribution |
| International Coverage | Primarily US-focused | Global POI database | 200+ countries, 100M+ places | 80+ countries but US is strongest | Mainly US & select markets |
| Ease of Use | Non-technical users can navigate it easily | Requires data engineering skills | Moderate – good for analysts | Relatively straightforward | Steeper learning curve |
| Data Sources | Multiple – apps, SDKs, partnerships | Opt-in GPS + POI aggregation | Massive proprietary network + partnerships | Primarily GPS from direct app partnerships | First-party mobile data + modeled insights |
| Pricing Transparency | Custom quotes only | Varies, contact for pricing | Custom enterprise pricing | Custom, reportedly more affordable than Placer | Custom quotes |
| Starting Price (Est.) | ~$350–$500/month | ~$200–$500/month | Custom / enterprise | ~$200–$400/month (reported) | Custom |
| Privacy Compliance | CCPA compliant, fully anonymized | CCPA & GDPR compliant | CCPA & GDPR compliant | Privacy-compliant across markets | CCPA compliant |
| Best For | Retail chains, CRE teams, CPG brands, civic planning | Data engineers building custom models | Global brands, ad tech, app developers | Budget-conscious US foot traffic use cases | Agencies measuring offline ad performance |
| Biggest Weakness | Pricey for small businesses; limited international data | No dashboard, not plug-and-play | Expensive at full enterprise level | Relies heavily on GPS data; less rich insights | Narrow use case outside ad measurement |