
")
Piktochart is a tool that functions as a mix of Canva, PowerPoint, and Adobe. Its main point is to turn information and ideas into clear, visually appealing content for both casual and professional uses without the associated design skills.
Key Features
1. Drag-And-Drop Editor
Piktochart’s drag-and-drop editor is what mainly makes this tool simple and intuitive. It forms a reverse approach to visual creation by letting users click on elements (text boxes, images, charts, and shapes) and then drag them wherever on the canvas. The editor also has guides and snapping to help align elements aesthetically.
2. Templates Library
The library is a collection of ready-made designs that function as starting points for projects. These help save time by providing structure and visual style without the technical hassle. All that’s needed is customization.
There are many categories to choose from: business letters, cards, presentations, posters, e-book covers, brochures, checklists, invoices, Zoom backgrounds, schedules, banners, social media posts, proposals, menus, and newsletters.
Each template in each category is tailored to suit a specific role/industry. There are templates that serve business, consulting, education, food, marketing, non-profit, and technology.
Note: Users can also start from a blank slate. There is no need to use templates if the creation doesn’t call for it.
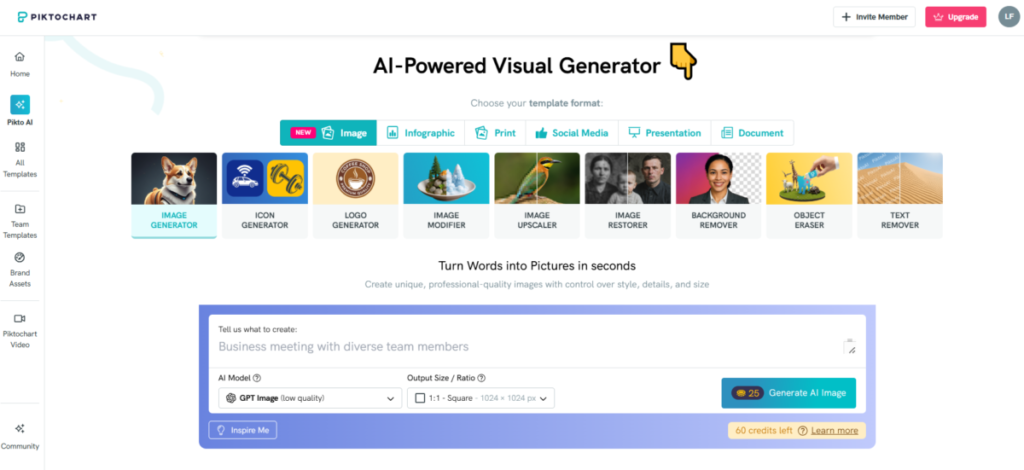
3. Visual Generator
This provides an even greater dose of personalization and customization. The generator helps to create images, icons, and logos from scratch without going through an editing process.
As an image generator, it can modify images.
Picktochart’s AI can restore images, remove backgrounds, erase elements, and upscale images. Then, there’s its ability to create custom infographics, prints, social media posts, presentations, and document layouts.
4. Video Transcription
Piktochart can transcribe video media files and Zoom recordings into text using machine intelligence. The transcript is presented as a text document that can be edited for mistakes and better word use. Piktochart caters to up to 60 languages and file types.
Note: Accuracy depends on the clarity and pronunciation of the audio.
5. Brand Assets
This is also called a brand kit and is a central feature that manages and applies visual identity consistently across all design creations. This is very beneficial for the collaborative work found in teams and businesses.
The brand assets store brand fonts and typography for use in every project. It can also create font schemes (headings, body text) for uniform text styling. Its branding abilities further extend to color palettes, templates, and logos.
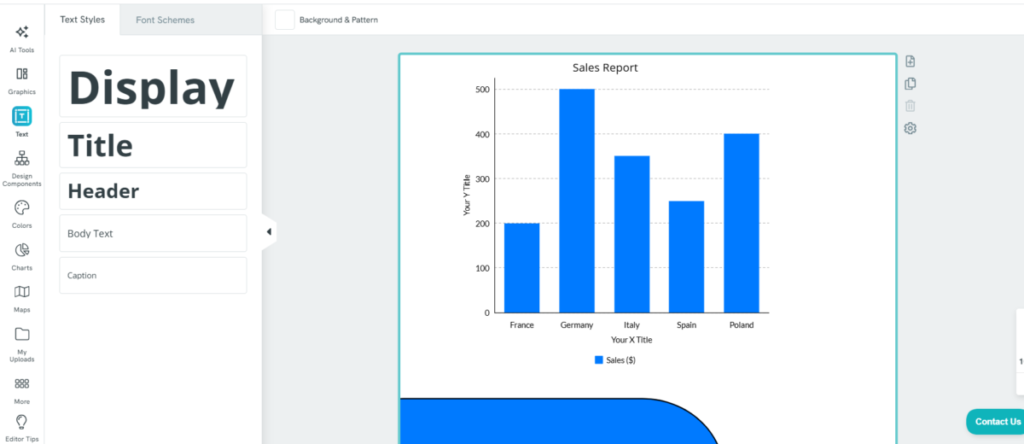
6. Data Visualization
Right in the template, Picktochart can create and add charts that present data at a glance. It also doesn’t need any technical knowledge, but a few clicks to produce bar charts, line graphs, pie charts, scatter plots, doughnuts, bubbles, and more.
Using Piktochart
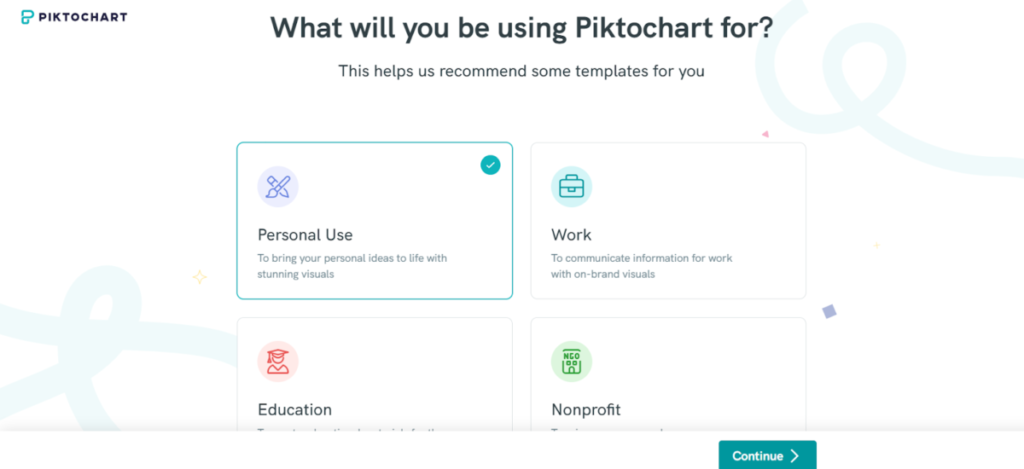
You will need to create an account using an email address. Then, Piktochart will ask about your purpose of using Piktochart to make template recommendations.
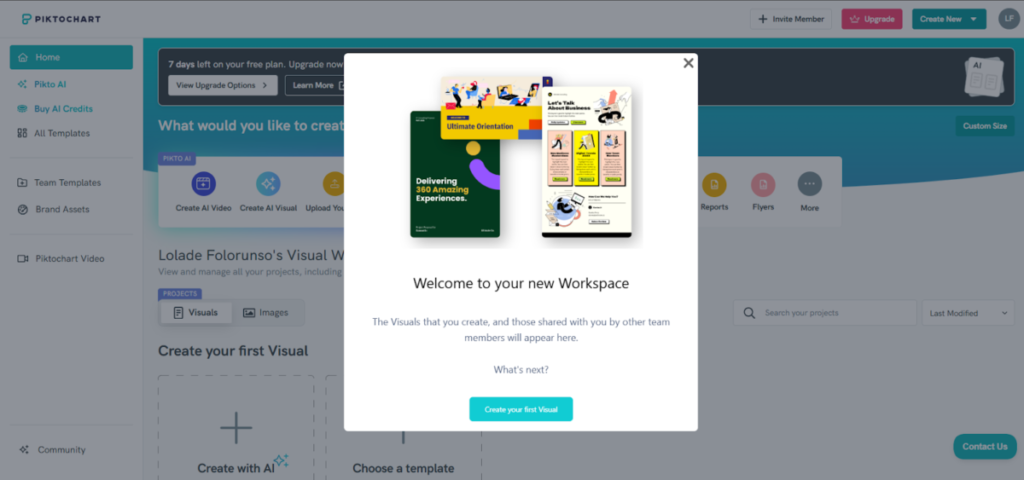
The account set-up process was swift. The tool opened up to a simple-styled dashboard that gave a starting pointer on how to use Piktochart.
Basically, Piktochart presents templates that align with specific topics: technology, marketing, business, and many more. You get to choose a template that fits and then edit the information to your own unique needs.
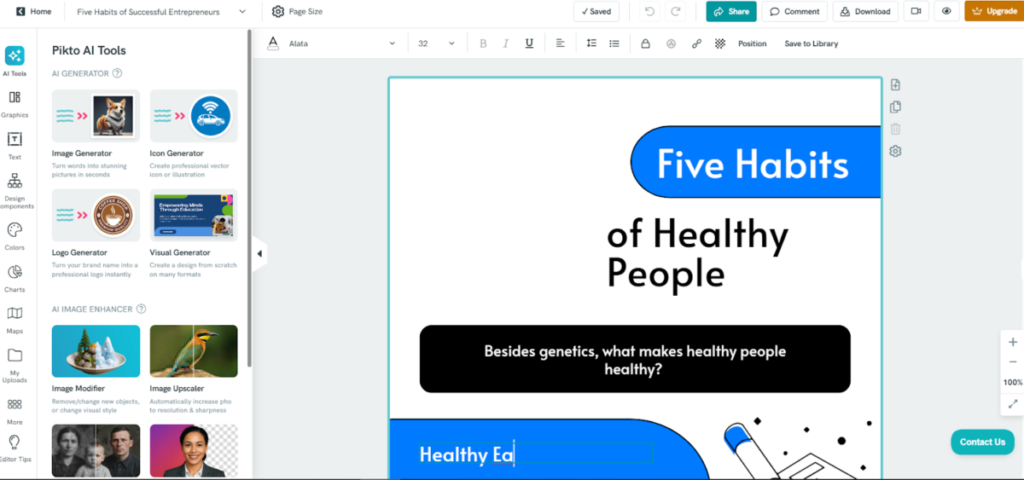
The first thing to note was that Piktochart did stick to its word; the templates were easy to edit. At some point, all I needed was to swap the texts. It took no technical skill to do this. I also found the drag-and-drop interface smooth.
One thing I really did like was the availability of an ample amount of editing tools. I could easily add a bar chart to present information, add images, include text and logos, and splatter on a color theme (even brand colors). While the color theme options were basic and limited at best, the allowance of brand colors mitigated the restriction.
The AI generator seemed like a standalone tool due to its extensive functionality.
I decided to explore the logo design option using a prompt with details for an Italian restaurant.
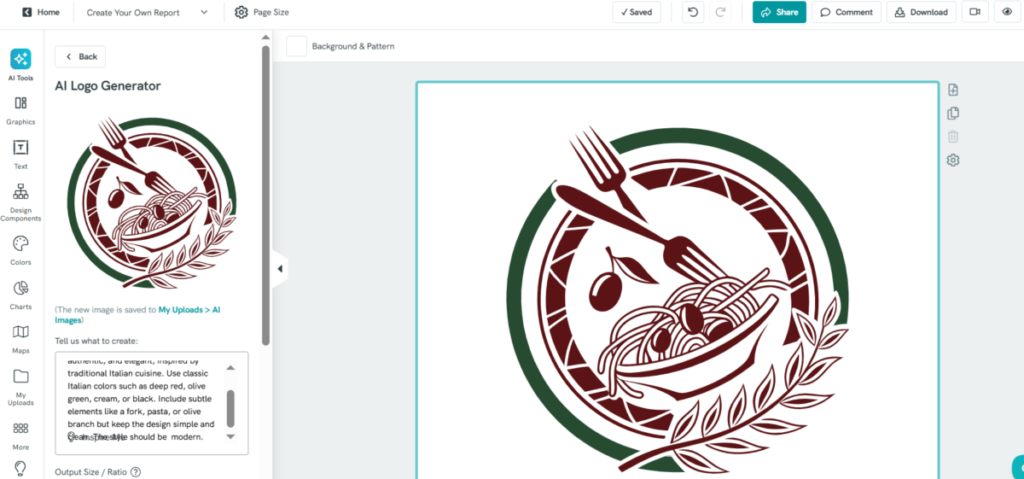
The AI did adhere to the prompt; it had my specified colors, elements, and style. Speaking of performance, Piktochart had a smooth run; there were no glitches or long loading durations. Also, all tasks are saved automatically; this takes out the fear of losing work done.
The Bottom Line
Piktochart is a comprehensive tool that caters to all things visuals. Its capabilities let anyone, even people lacking technical skills, make and edit images, logos, presentations, and a long list of other visual media.